When would you be better off not wearing your seatbelt?
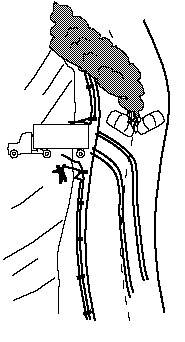
My friend Eddie's Uncle Joe heard about this truck driver who narrowly avoided a fiery wreck by plunging his truck through the gaurdrail and down a 100 meter cliff. If he had had his seatbelt on, he would never have been able to jump out at the last second and hang on to the gaurdrail.

Maybe so.

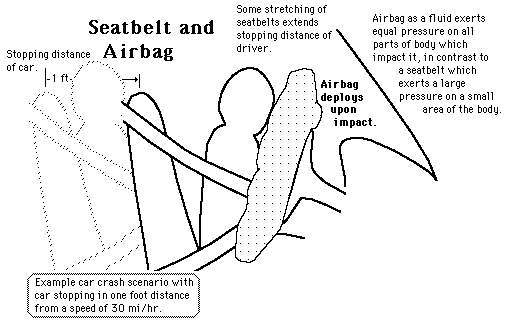
But the work-energy principle must be satisfied in every collision, and it dictates that the work done in stopping the driver must be equal to the driver's kinetic energy. The shorter the stopping distance, the greater the impact force. And cases where the seatbelt would not lengthen your stopping distance and decrease your impact force are about as rare as this kind of accident.

Rather than making judgements about safety from anecdotes like the one above, it is wise to consider the evidence from the large database on traffic fatalities.

Index

Work-energy principle

Car crash scenario
 
HyperPhysics***** Mechanics R Nave
Go Back


While the driver with an airbag may experience the same average impact force as the driver with a good seatbelt, the airbag exerts an equal pressure on all points in contact with it according to Pascal's principle. The same force is distributed over a larger area, reducing the maximum pressure on the body.

Index

Work-energy principle

Car crash scenario
 
HyperPhysics***** Mechanics R Nave
Go Back


Protection by Seatbelts

Vehicle Occupant Protection Device Effectiveness in Preventing Fatalities
Car Driver Lap/ shoulder belt 42 +/- 4%
Car Right front passenger Lap/ shoulder belt 39 +/- 4%
Car Left rear passenger Lap belt 19 +/- 10%
Car Right rear passenger Lap belt 17 +/- 9%
Motorcycle Driver Helmet 27 +/- 9%
Motorcycle passenger Helmet 30 +/- 8%
From Leonard Evans, "The Science of Traffic Safety", The Physics Teacher 26, October 1988, Page 431, Table I.

Data on seatbelt effectiveness was obtained by comparing severe accidents in which at least one person was killed. An effectiveness of 42% for drivers with seatbelts means that a 42% reduction in fatalities would occur if all drivers wore seatbelts.

Index

Car crash scenario
 
HyperPhysics***** Mechanics R Nave
Go Back


Vehicle Mass and Accidents


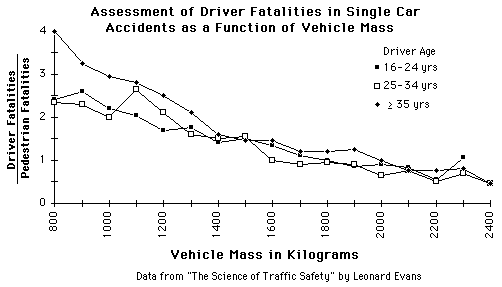
The more massive vehicle in a two-vehicle collision would be presumed to be safer since it would undergo less change in velocity during the collision. Not so evident is the fact that the more massive car is safer in a single-car accident. Leonard Evans collected data from the FARS database for a Fatality vs Mass comparison. His problem in assessing the rate of incidence of fatal accidents was to have a base for comparison since non-fatal single car accidents are not included in the database, nor are the number of cars in a given mass range. He used the number of pedestrian fatalities as a base, a "surrogate" for the number of serious accidents of all types, since it was presumed that the ratio of collisions with pedestrians to other types of collisions, e.g. with trees, would be similar for any mass class. It was also presumed that the pedestrian fatality rate would be more-or-less independent of car mass since even the lightest car is so much more massive than a pedestrian. The self-consistency of the curves for different ages of driver offers some evidence of validity since their accident rates were much different.
Trucks: more likely to 'win' in car crash
Index

Car crash scenario
 
HyperPhysics***** Mechanics R Nave
Go Back


Traffic Accident Data

The U S Department of Transportation keeps data on traffic accidents including the Fatal Accident Reporting System (FARS) with fatalities since 1975 which number over a half million (averaging 45,000 per year in the US). Each year there are about 18 million property damage crashes with 1.7 million injuries. The risk of accidents for young drivers is greater in all categories of accidents, 18 yr olds having 400% more accidents than 40 yr olds. Analysis of such data permits reasonable estimation of factors which influence safety such as vehicle mass and the use of seatbelts. Some interesting human factors come into play. For example, given a severe crash, the driver of a 900 kg car is about 2.6 times more likely to be killed than the driver of an 1800 kg car. But overall data indicates that 1.7 times as many drivers of 900 kg cars are killed, compared to 1800 kg cars, indicating that drivers of light cars are more cautious and less likely to have such accidents. In seatbelt statistics, it must be factored in that persons who choose not to use seatbelts are more likely to have accidents out of a higher general bent toward risk taking.

Source: Leonard Evans, "The Science of Traffic Safety", The Physics Teacher 26, October 1988, Page 431.
Index

Car crash scenario
 
HyperPhysics***** Mechanics R Nave
Go Back


Trucks: more likely to 'win' in car crash

Phil Frame, a spokesman for the National Transportation Safety Board, said that while large trucks are not part of most deadly wrecks, "they are overrepresented in the number of fatal accidents they are involved in."

In 1997, they accounted for 9 percent nationally of all vehicles in fatal wrecks, but accounted for only 3 percent of all registered vehicles and 7 percent of total vehicle miles traveled, the national transportation statistics show.

"The greater mass vehicle almost always wins in a vehicle crash", Frame said.

78 percent of the people who died after collisions with big trucks were occupants of the other vehicle, and 75 percent of the people who were injured were in the other vehicle."

Excerpts from "Facts counter fear about big rigs", by Jennifer Brett, Atlanta Journal.

Spokesmen for the trucking industry are quick to point out that truck drivers are better trained, and safer drivers than the general public - and that is believable. But just the physics of collisions dictates that the occupant of the less massive vehicle is more at risk when a collision does occur.

Why it's better to be in the truck
Index

Car crash scenario
 
HyperPhysics***** Mechanics R Nave
Go Back