Color Coverage Examples
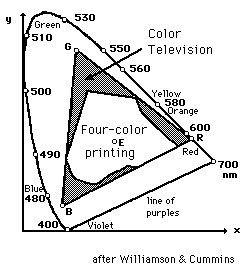
One of the uses of the CIE chromaticity diagram is to show what part of the human color perception range can be covered by various color imaging methods. The outline shows the full range of perceivable colors. The triangle outlines the range covered by red, green, and blue phosphors on a color television screen, and the inner diagram shows the range available to commercial four-color printing processes. The range of colors accessible to a given process is called it's "gamut".

Gamut for RGB Primaries
Index

CIE concepts

Vision concepts

Color vision concepts

Reference
Williamson & Cummins
Ch 3
 
HyperPhysics***** Light and Vision R Nave
Go Back


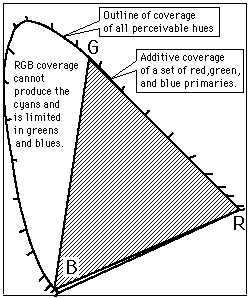
Gamut of Additive Coverage with RGB Primaries

The solid outline from the CIE Chromaticity Diagram shows the range of perceivable hues for the normal human eye. The triangle shows the range of purely additive coverage with the early standard RGB primaries.

Compare with 4-color printing
Index

CIE concepts

Vision concepts

Color vision concepts

Reference
Williamson & Cummins
 
HyperPhysics***** Light and Vision R Nave
Go Back


Additive Color Mixing with CIE

The result of adding two colors of light can be worked out as a weighted average of the CIE chromaticity coordinates for the two colors. The weighting factors involve the brightness parameters Y. If the coordinates of the two colors are

then the additive mixture color coordinates are

This linear procedure is valid only if the colors are relatively close to each other in value.

Index

CIE concepts

Vision concepts

Color vision concepts

Reference
Williamson & Cummins
Ch 3
 
HyperPhysics***** Light and Vision R Nave
Go Back