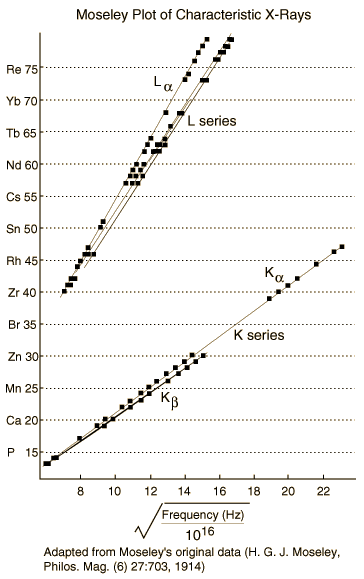
When the square root of the frequencies of the characteristic x-rays from the elements is plotted against the atomic number, a straight line is obtained. In his early 20's, Moseley measured and plotted the x-ray frequencies for about 40 of the elements of the periodic table. He showed that the K-alpha x-rays followed a straight line when the atomic number Z versus the square root of frequency was plotted. With the insights gained from the Bohr model, we can write his empirical relationship as follows:

Calculation and further detail.Some history
Labeling of x-ray transitions
Table of K-alpha x-ray energies
Index
 
HyperPhysics***** Quantum Physics R Nave
Go Back


Moseley's Modeling of X-ray Frequencies

Moseley's empirical formula for K-alpha x-rays when adapted to the Bohr model becomes

The implication of this relationship is that the single electron in the K-shell before the emission is almost 100% effective in shielding the nucleus so that the electron from the L-shell sees an effective nuclear charge of Z-1. We can use this relationship to calculate approximate quantum energies and wavelengths for K-alpha x-rays.

For the element with Z = ,

the corresponding quantum energy for the K-alpha x-ray is = keV

and the wavelength is = nm.

For example, this calculation for Z=42 gives a wavelength of 0.0722 nm for the molybdenum K-alpha x-ray whereas the measured value is 0.0707 nm. So the agreement is reasonable for K-alpha x-rays even though the upper level of the transition experiences some shielding which is unaccounted for in this model.

For transitions ending in higher shells, the shielding situation becomes much more complex. From the Bohr model, we might write an equation for an L-alpha x-ray as

Moseley found that his data for the L-alpha x-rays fit the empirical relationship

so that the best fit to the data was with Z-7.4, indicating a shielding corresponding to 7.4 electrons on the average inside the M-shell from which the electron originated.

Moseley plotX-ray tubeLabeling of x-ray transitions
Table of K-alpha x-ray energies
Index
 
HyperPhysics***** Quantum Physics R Nave
Go Back


Moseley's Investigation of X-rays

Henry G. J. Moseley (1887-1915) was described by Rutherford as his most talented student. When he was in his early 20's, he measured and plotted the x-ray frequencies for about 40 of the elements of the periodic table. He showed that the K-alpha x-rays followed a straight line when the atomic number Z versus the square root of frequency was plotted. His data (the Moseley plot) is still a standard feature of physics textbooks.

At the time when he was working, most physicists regarded the atomic weight A as the key to ordering the periodic table, rather than the atomic number Z. For example, nickel, with atomic weight 58.7 was placed ahead of cobalt, atomic weight 58.9, in the periodic table. Moseley's work showed that cobalt had an atomic number of 27 and nickel 28. Potassium (Z=19, A=39.10) and Argon (Z=18, A=39.95) were also reversed when listed by atomic weight order. Moseley predicted the existence of an element at Z=72 (Hafnium) which was subsequently discovered in Bohr's laboratory in Copenhagen.

Moseley volunteered for combat duty during World War I and was killed in action at age 27 during the attack on Gallipoli in the Dardenelles.

Moseley plot of characteristic x-rays
Index
 
HyperPhysics***** Quantum Physics R Nave
Go Back