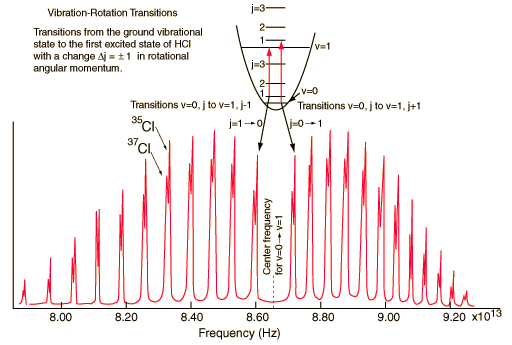
Vibration-Rotation Spectrum of HClA classic among molecular spectra, the infrared absorption spectrum of HCl can be analyzed to gain information about both rotation and vibration of the molecule. The absorption lines shown involve transitions from the ground to first excited vibrational state of HCl, but also involve changes in the rotational state. The rotational angular momentum changes by 1 during such transitions. If you had a transition from j=0 in the ground vibrational state to j=0 in the first excited state, it would produce a line at the vibrational transition energy. As observed, you get a closely spaced series of lines going upward and downward from that vibrational level difference. The splitting of the lines shows the difference in rotational inertia of the two chlorine isotopes Cl-35(75.5%) and Cl-37(24.5%). From the spectrum above, you can examine details about the following:
|
Index Molecular spectra concepts Reference Tipler & Llewellyn Sec. 9-4 | |||||
HyperPhysics***** Quantum Physics | Go Back |
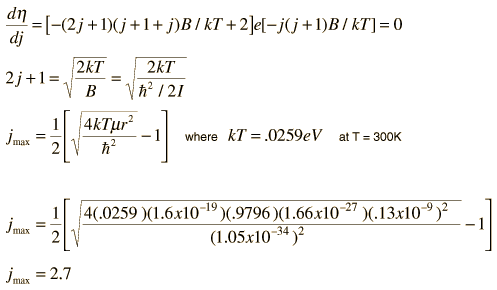
Peak Intensity for HCl SpectrumNote that the spectral lines closest to the center of the HCl spectrum are not the strongest transitions. The intensity goes through a maximum and then drops off for higher values of rotational angular momentum j. The condition for maximum intensity is that the number of molecules which will occupy the lower state of the transition is a maximum. Since for a given value of j there are 2j+1 states of the same energy (degenerate states), the higher j states have a statistical advantage. However, higher energy state population is reduced by the Boltzmann factor so that the net population for a given rotational state is given by: The value of j associated with the highest population can be determined by taking the derivative of the population with respect to j. This gives So the lower states with j=2 and 3 are those which are expected to give the highest intensities, and that is borne out by the experimental spectrum. |
Index Molecular spectra concepts Reference Tipler & Llewellyn Sec. 9-4 |
HyperPhysics***** Quantum Physics | Go Back |
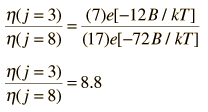
Relative Intensity for HCl LinesDetermining the relative intensities of spectral lines is an important part of the analysis of spectra. Examination of the experimental HCl spectrum shows a characteristic variation of intensity with the j value for the transition. At first glance, it would appear that the peak intensities should scale with the relative population of the lower state in the transition. The population of the upper vibrational state is very low at room temperature, as indicated by the following analysis: If we use only the lower state population as an index and compare the j=3, v=0 state to the j=8,v=0 state, the relative population should be But the measured relative peak height on the HCl spectrum for the j=3 and j=8 peaks is only about 2.3 . Not knowing the nature of the spectrum detection, one could look at the relative intensities of the Cl-35 and Cl-37 peaks, which should have a 3:1 ratio of intensity based on the 3:1 abundance ratio for those isotopes. The Cl-35 peaks scale only about 1.3 times the Cl-37 peaks. |
Index Molecular spectra concepts |
HyperPhysics***** Quantum Physics | Go Back |